


By PickAlpha Research
Every selloff in AI chips comes with two explanations, usually after the fact. Either the cycle is breaking, or too many people were in the same trade. Those call for very different responses, and by the time someone explains which it was, the move is over.
We built a page that tells them apart while it’s happening: pickalpha.ai. It’s free, public, and updates every day.
Two questions, twenty signals
The Monitor plots the AI-chip trade on two axes.
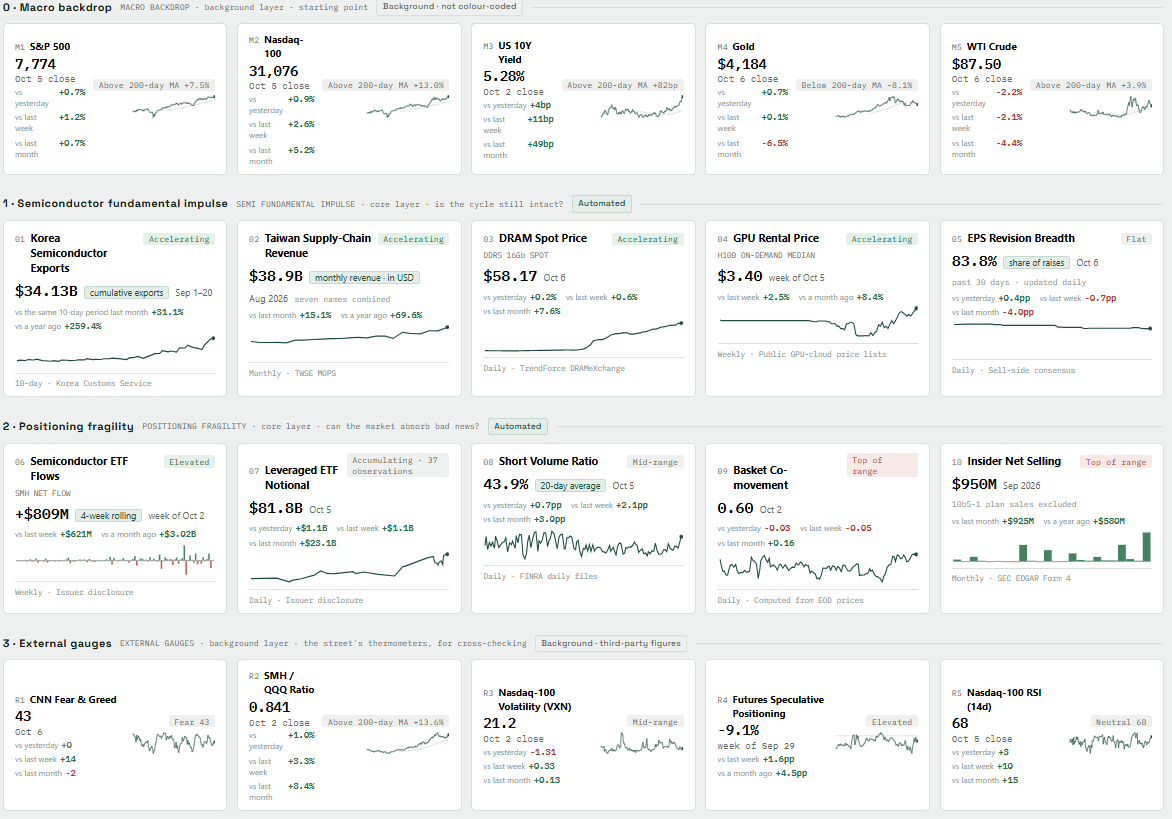
Across: is the cycle still intact? Korean chip exports, Taiwan supply-chain revenue, DRAM spot prices, GPU rental rates. We track momentum, not level, because in a super-cycle the level looks great right up to the day it cracks.
Up: can the market absorb bad news? ETF flows, leveraged ETF exposure, short volume, how tightly the basket trades together, and insider selling.
Every input is public data, and every sentence on the page is generated by rule. Same data, same sentence. No analyst opinion.
Four places to be
Fundamentals running, positioning light (bottom right): the most comfortable place to hold.
Story intact, but crowded (top right): slow up, fast down. The largest downside exposure.
Bad news meets crowding (top left): basket-wide selling, not single-stock fundamentals.
Story damaged, positioning washed out (bottom left): the risk has already been traded.
A grey cross through the middle marks each axis’s normal noise. Inside it, the map says “Undecided” and names nothing. A quadrant gets named only when both axes clear the band.
This week’s read
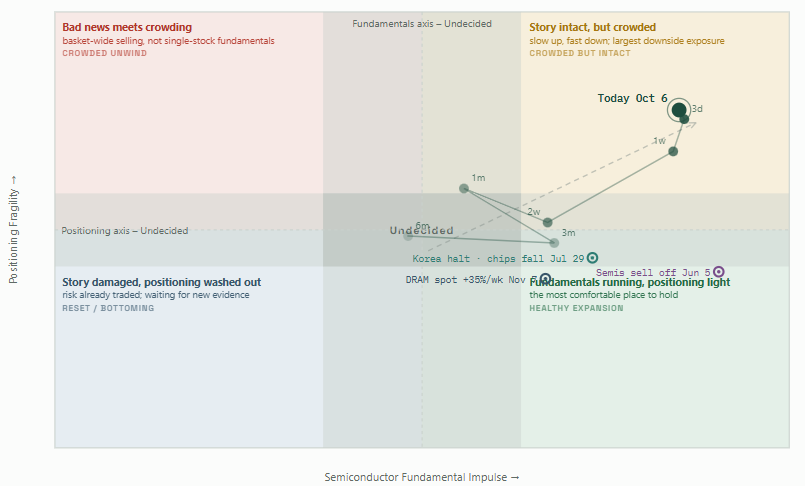
Then, this week, something telling happened. The fundamental axis barely moved (+0.01). Crowding rose another 0.11. The dot, which crossed into the top right a week earlier, kept climbing.
Story intact, but crowded.
What put it there:
The story is fine. Taiwan supply-chain revenue momentum is at its highest in two years.
The basket trades like one stock. Co-movement is at the 97th percentile, so one piece of bad news now hits all twelve names at once.
Four of the five positioning signals read high. The exception is that money is still flowing into SMH, $809M over four weeks. That’s the map’s only contrary evidence.
Checking it against the headlines
The map runs on data, not headlines. But the past two weeks of news line up with it on both axes.
The story got stronger. On Sept. 30, Micron reported a record $54.2 billion quarter, guided to another record, and said memory will be “much tighter” in fiscal 2027 and 2028 than this year. Hours later, Korea reported record September chip exports: $60.3 billion, up 263% from a year earlier. TSMC’s August revenue, the month behind our Taiwan reading, rose 53% to a record.
So why did our fundamentals axis barely move? Because it was already near the top: Taiwan at its two-year high, Korea close behind. A record month confirms an accelerating cycle, but it can’t push the reading much higher. Even the soft spot matches: DRAM spot prices are up a modest 7% in four weeks, and TrendForce expects contract-price gains to slow to 10–15% this quarter.
The crowd got bigger. On Oct. 1, chip stocks rallied across Asia on those same two headlines: SK hynix rose 3%, Tokyo Electron 6.5%, Advantest nearly 10%, and Taiwan’s market closed at a record. Nvidia hit an all-time high in the same stretch, days after authorizing a record $150 billion buyback. All of it happened while the 10-year Treasury yield climbed to its highest level since 2002, a backdrop that usually weighs on high-multiple stocks.
Everyone buying the same names, for the same reason, on the same day, regardless of rates: that’s what a 97th-percentile co-movement reading looks like from the inside.
We checked our own work
Last Wednesday the map jumped, so we traced it. Three filings by a single director had pushed the crowding axis up 0.185 in one day. That’s one person’s selling schedule, not the market’s positioning.
So we switched the insider signal to a three-month average, recomputed the history, and logged the change on the page. The dot is still in the top right. The crowding is broad, not one person.
What this is not
The map describes where the trade stands, not where it goes next. Crowded trades can keep grinding higher; “slow up” is part of the name. This is not a timing signal, and not investment advice.
What’s next
Our morning report is coming back, rebuilt around the AI-chip trade and this Monitor, and arriving from a new address. If you subscribe here, you don’t need to do anything: you’ll get it automatically. Full details this weekend.
Questions, or a signal you think we’re missing? Leave a comment below, or use the feedback form at the bottom of pickalpha.ai. We read everything.