


The semiconductor sector has just experienced one of its sharpest selloffs of the year.
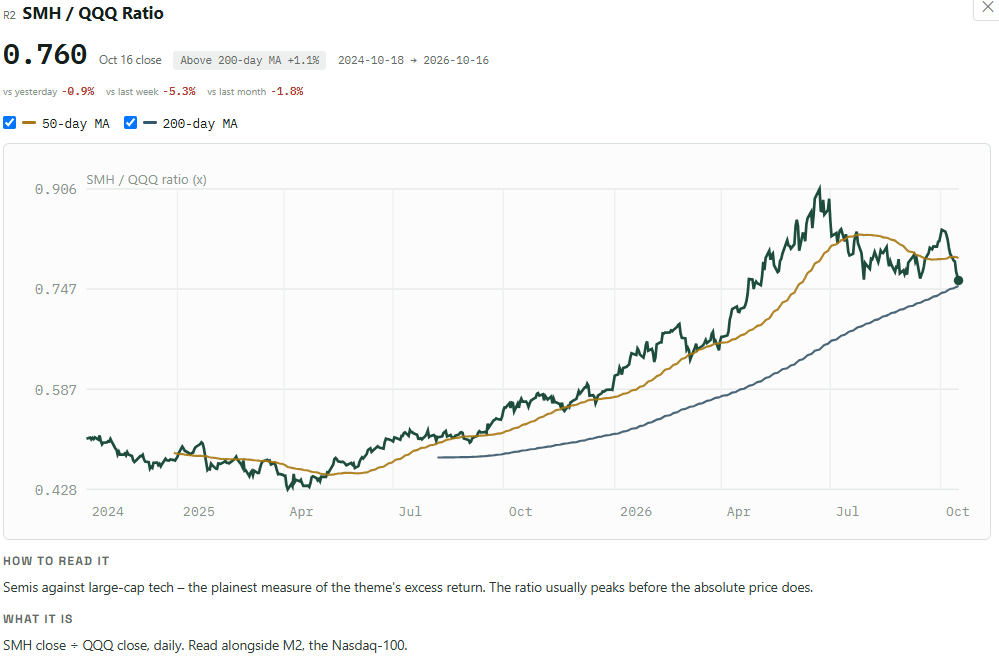
SMH/QQQ relative performance through October 16, 2026. Source: PickAlpha.
The Nasdaq fell 4.5% in the week ending October 16, while the Philadelphia Semiconductor Index suffered eight consecutive sessions of losses. Selling pressure spread across U.S. chipmakers, Korean memory producers, and AI infrastructure companies.
But there are two fundamentally different questions behind a semiconductor correction:
Is the underlying industry cycle weakening? Or is the market unwinding an increasingly crowded position?
Both can cause sharp equity declines, but they carry different implications for investors.
That distinction is the foundation of the PickAlpha Regime Map.
Two Axes, Two Different Questions
Our Regime Map separates the AI and semiconductor investment cycle into two dimensions:
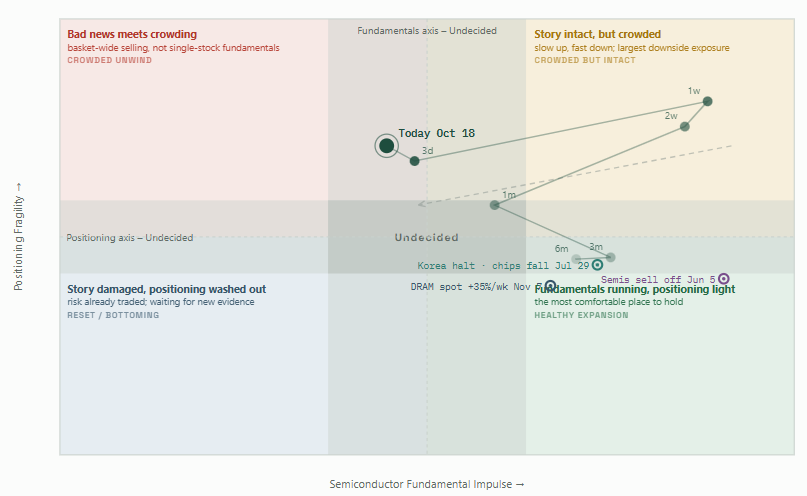
The horizontal axis – Semiconductor Fundamental Impulse – measures whether the underlying business cycle is strengthening or losing momentum, based on industry demand, pricing, revenue, and earnings evidence.
The vertical axis – Positioning Fragility – measures how vulnerable semiconductor equities are to a broader unwind, using fund flows, leveraged exposure, shorting activity, stock co-movement, and insider selling.
Together, they define four market regimes: healthy expansion, crowded but fundamentally supported markets, deteriorating fundamentals with fragile positioning, and damaged fundamentals after positioning has been unwound.
The neutral bands matter too. When the evidence is mixed, the model says Undecided rather than forcing a directional conclusion.
Under the Hood: Our 10 Core Signals
The framework monitors five fundamental indicators and five positioning indicators, each capturing a different part of the semiconductor investment cycle.
Part I – Semiconductor Fundamentals

01. Korea Semiconductor Exports – The earliest hard-data pulse
South Korea releases semiconductor export data every ten days, providing one of the fastest official readings of industry activity. We track growth momentum to identify potential acceleration or deceleration in demand.
02. Taiwan Supply-Chain Revenue – Turning demand into actual sales
Monthly reported revenue across seven major Taiwanese semiconductor and AI supply-chain companies helps us assess whether industry demand is translating into actual sales.
03. DRAM Spot Prices – A market-based view of memory demand
We track DDR5 spot-price momentum as a timely indicator of memory supply-demand conditions. Sustained price changes may reveal shifts in the memory cycle before they fully appear in earnings.
04. GPU Rental Prices – Is AI compute becoming scarce or abundant?
We monitor Nvidia H100 cloud rental pricing to assess the balance between available AI compute capacity and market demand.
05. EPS Revision Breadth – Do earnings expectations confirm the cycle?
We measure the proportion of upward versus downward analyst EPS revisions across our semiconductor basket, connecting industry observations with forward earnings expectations. This signal is monitored but is not yet eligible for the live composite.
Part II – Positioning Fragility

06. Semiconductor ETF Flows – Is capital entering or leaving the trade?
We track rolling four-week net flows into SMH. Sustained inflows indicate continued investor demand, while sharp outflows can reveal an ongoing reduction in sector exposure.
07. Leveraged ETF Exposure – The amplification channel
We monitor leveraged semiconductor ETF exposure through SOXL and SOXS, assessing the potential for daily rebalancing mechanics to amplify market moves relative to underlying trading liquidity.
08. Short Volume Ratio – Measuring short-side activity
We measure short-sale volume as a share of total trading volume across the semiconductor basket. Changes can reveal shifts in hedging and short-side trading activity, although short volume is not equivalent to outstanding short interest.
09. Basket Co-movement – When stocks trade as one position
We track how closely semiconductor stocks move together after accounting for broader market influences. Elevated co-movement can indicate greater vulnerability to sector-wide selling, regardless of individual company fundamentals.
10. Insider Net Selling – What are corporate insiders doing?
We monitor reported net insider selling, excluding identified pre-arranged selling plans, as a supplementary indicator of positioning and potential changes in insider behavior.
What the Map Says After This Week’s Selloff
As of October 18, PickAlpha’s Regime Map reads:
Fundamental Impulse: 0.45 – Undecided
Positioning Fragility: 0.71 – Crowded
The historical path shows a meaningful shift from the upper-right region, where fundamentals were supportive but positioning was crowded, toward the center of the fundamental axis.
Yet the most interesting observation lies beneath the composite reading.
Korean semiconductor exports and Taiwan supply-chain revenue currently show very weak momentum, with normalized contributions of 0.04 and 0.08. Meanwhile, DRAM spot prices and GPU rental prices remain considerably stronger, contributing 0.66 and 1.00.
The neutral fundamental reading reflects conflicting evidence, not an absence of risk.
On the positioning side, fragility remains elevated even after the recent selloff. The latest reading reflects increased leveraged ETF exposure pressure, while broader positioning indicators continue to point to a vulnerable market environment.
The map therefore captures two important features of the current market: weakening but still-divided fundamental signals, alongside persistent positioning fragility.
It does not establish that the semiconductor cycle has broken. Nor does it suggest that the correction has necessarily removed the market’s downside vulnerability.
A Map of the Present, Not a Forecast of the Next Move
The Regime Map measures where the market stands today. It does not predict where the next point will appear.
The historical path describes how underlying evidence has evolved, not a projected market trajectory. Today’s combination of undecided fundamentals and elevated positioning fragility does not mean the market must move into the upper-left quadrant.
Several paths remain possible
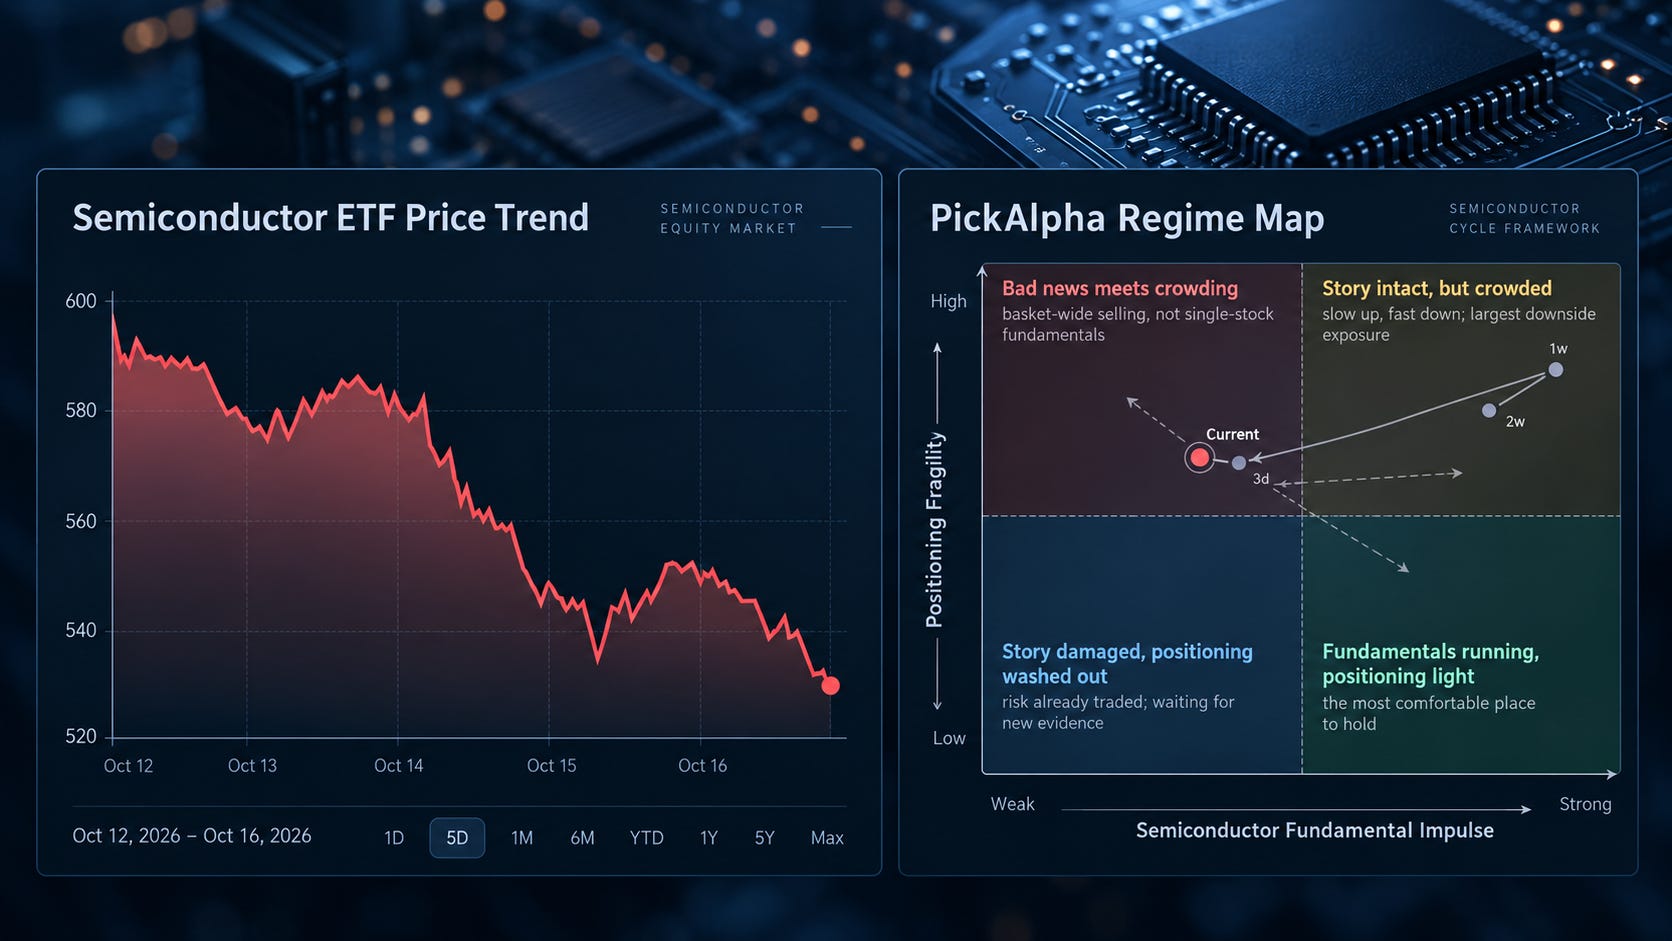
If fundamental weakness broadens, softer memory pricing, GPU rental economics, and earnings revisions could confirm the deterioration already visible in export and revenue momentum, moving the fundamental reading further left.
If industry demand proves resilient, improving revenue momentum and sustained pricing strength could move the fundamental reading back toward the right, even while equity markets remain volatile.
If positioning pressure eases, declining co-movement, reduced leveraged exposure, and stabilizing fund flows could move the map downward, indicating a less fragile market regardless of whether fundamentals improve.
The map could also remain near its current position if evidence stays mixed. None of these paths is a forecast. They simply illustrate how different economic and market developments would be reflected in the framework as new data become available.
For investors, the value is not in anticipating the next quadrant, but in understanding the current environment – whether risks are fundamentally driven, positioning-driven, or a combination of both.
Our additional macro and external market gauges provide further context, helping investors interpret these semiconductor-specific conditions within the broader market without influencing the core regime calculation.
We do not have to predict the next market move to make better-informed investment decisions today.
That is the purpose of the PickAlpha Regime Map: to make fundamental momentum, positioning risk, and conflicting evidence visible within a consistent, systematic framework.
Explore the live Regime Map and underlying signals at PickAlpha.ai.